A bit of history. Not so long ago, we tried to use GPU acceleration from Python. We benchmarked NumPy vs CuPy in the most common number-crunching tasks. We took the highest-end desktop CPU and the highest-end desktop GPU and put them to the test. The GPU, expectedly, won, but not just in Matrix Multiplications.
Sorting arrays, finding medians, and even simple accumulation was vastly faster.
So we implemented multiple algorithms for parallel reductions in C++ and CUDA, just to compare efficiency.
CUDA was obviously harder, than using std::accumulate, but there is a shortcut: thrust::reduce.
- Frm a usage perspective, they are almost equally simple.
- From a performance perspective, the latter was 10x faster on 1 GB arrays.
We only reached 89 GB/s throughput on the CPU, while the technical docs suggest a number 129% higher:
One ThreadripperTM PRO integrates up to eight chiplets, each with access to memory, I/O and each other via the established hyper-speed AMD InfinityTM Fabric interconnect. ThreadripperTM PRO bar-raising core counts would count for naught were they supported by insufficient memory, with respect to not just bandwidth, but capacity and latency as well. AMD ensured ThreadripperTM PRO memory subsystem would be up to the task, as the 3900WX processor family is backed up with the most on-chip cache and highest performing memory available in a single x86 CPU socket: eight 3200 MHz DDR4 memory channels with ECC, supporting up to 2 TB capacity, and delivering up to 204 GB/s of aggregate bandwidth, more than double that of Intel Xeon W-2200 family.
I was sleepless, so I tried more things.
Initial Version
Our initial version contained some AVX2 code for 8-way accumulation into one YMM register plus 64x std::threads:
| |
More Attempts
I started by enabling CPU frequency scaling and reducing the benchmark time to 10 seconds. CPU went up from 2.7GHz to 4 GHz on all 64 cores.
Logic
- Created an always-waiting thread-pool to avoid restarting threads.
- Replaced
forwithif+[[likely]]+gotocombination. - Precomputed the last pointer of
AVX, instead ofwhile (x + 8 < end). - Switched from
AVXto lighterSSE. - Switched from
doubletofloat. - Switched from 8-way accumulation (1x
YMMregister) to 32-way (4xYMMregisters), effectively 4x unrolling the loop. - Freed 4 threads.
Every idea above - failed, except for one - the last one. It’s the difference between 89 GB/s and 112 GB/s - 122 GB/s depending on the run. Important to note that using even fewer cores (like 32 or 48) degraded the performance.
Memory
Once done with logic, I tried a couple of tricks for the memory subsystem.
- Using
_mm_prefetchbefore the next round of evaluation. - Switching from
_mm256_loadu_psto_mm256_castsi256_ps(_mm256_lddqu_si256(ptr)) - Switching from
_mm256_loadu_psto_mm256_load_ps. - Switching from
_mm256_loadu_psto_mm256_stream_load_si256.
For variants #2, #3 and #4 I switched to aligned_alloc.
It was just easier, than std::accumulate-ing the inputs until first aligned address.
Nothing helped here, but in general I would use those instruction for something like:
- Use
_mm_prefetchfor a fast binary search. - Use
_mm256_lddqu_si256in mid-length text search with frequent split loads. - Use
_mm256_load_psfor advanced computing on big aligned buffers. - Use
_mm256_stream_load_si256for lite scans, to avoid cache pollution.
Bigger Datasets
We had 24 GB of VRAM on the GPU and used 1÷24th of it for the input. I tried increasing the CPU task size to 1TB÷24 = 42 GB, no benefit. Each of our RAM sticks has the capacity of 128 GB, so the 42x bigger dataset still fits onto one stick. So I repeated the CPU experiments on a 512 GB dataset. No bandwidth improvement, but a significant loss…
Performance Analysis
This is a weekend activity between two hectic weeks, so I will not disassemble the binaries.
But we will look into the runtime metrics.
I have isolated 120 threads for us and run perf:
| |
Here are the results:
| |
Only 0.18 instructions per cycle, on average.
A good result for scalar code would be above 2.
Cache misses were only at 2%.
The biggest bottleneck is the backend.
86.48% backend cycles were idle, waiting for memory to be fetched.
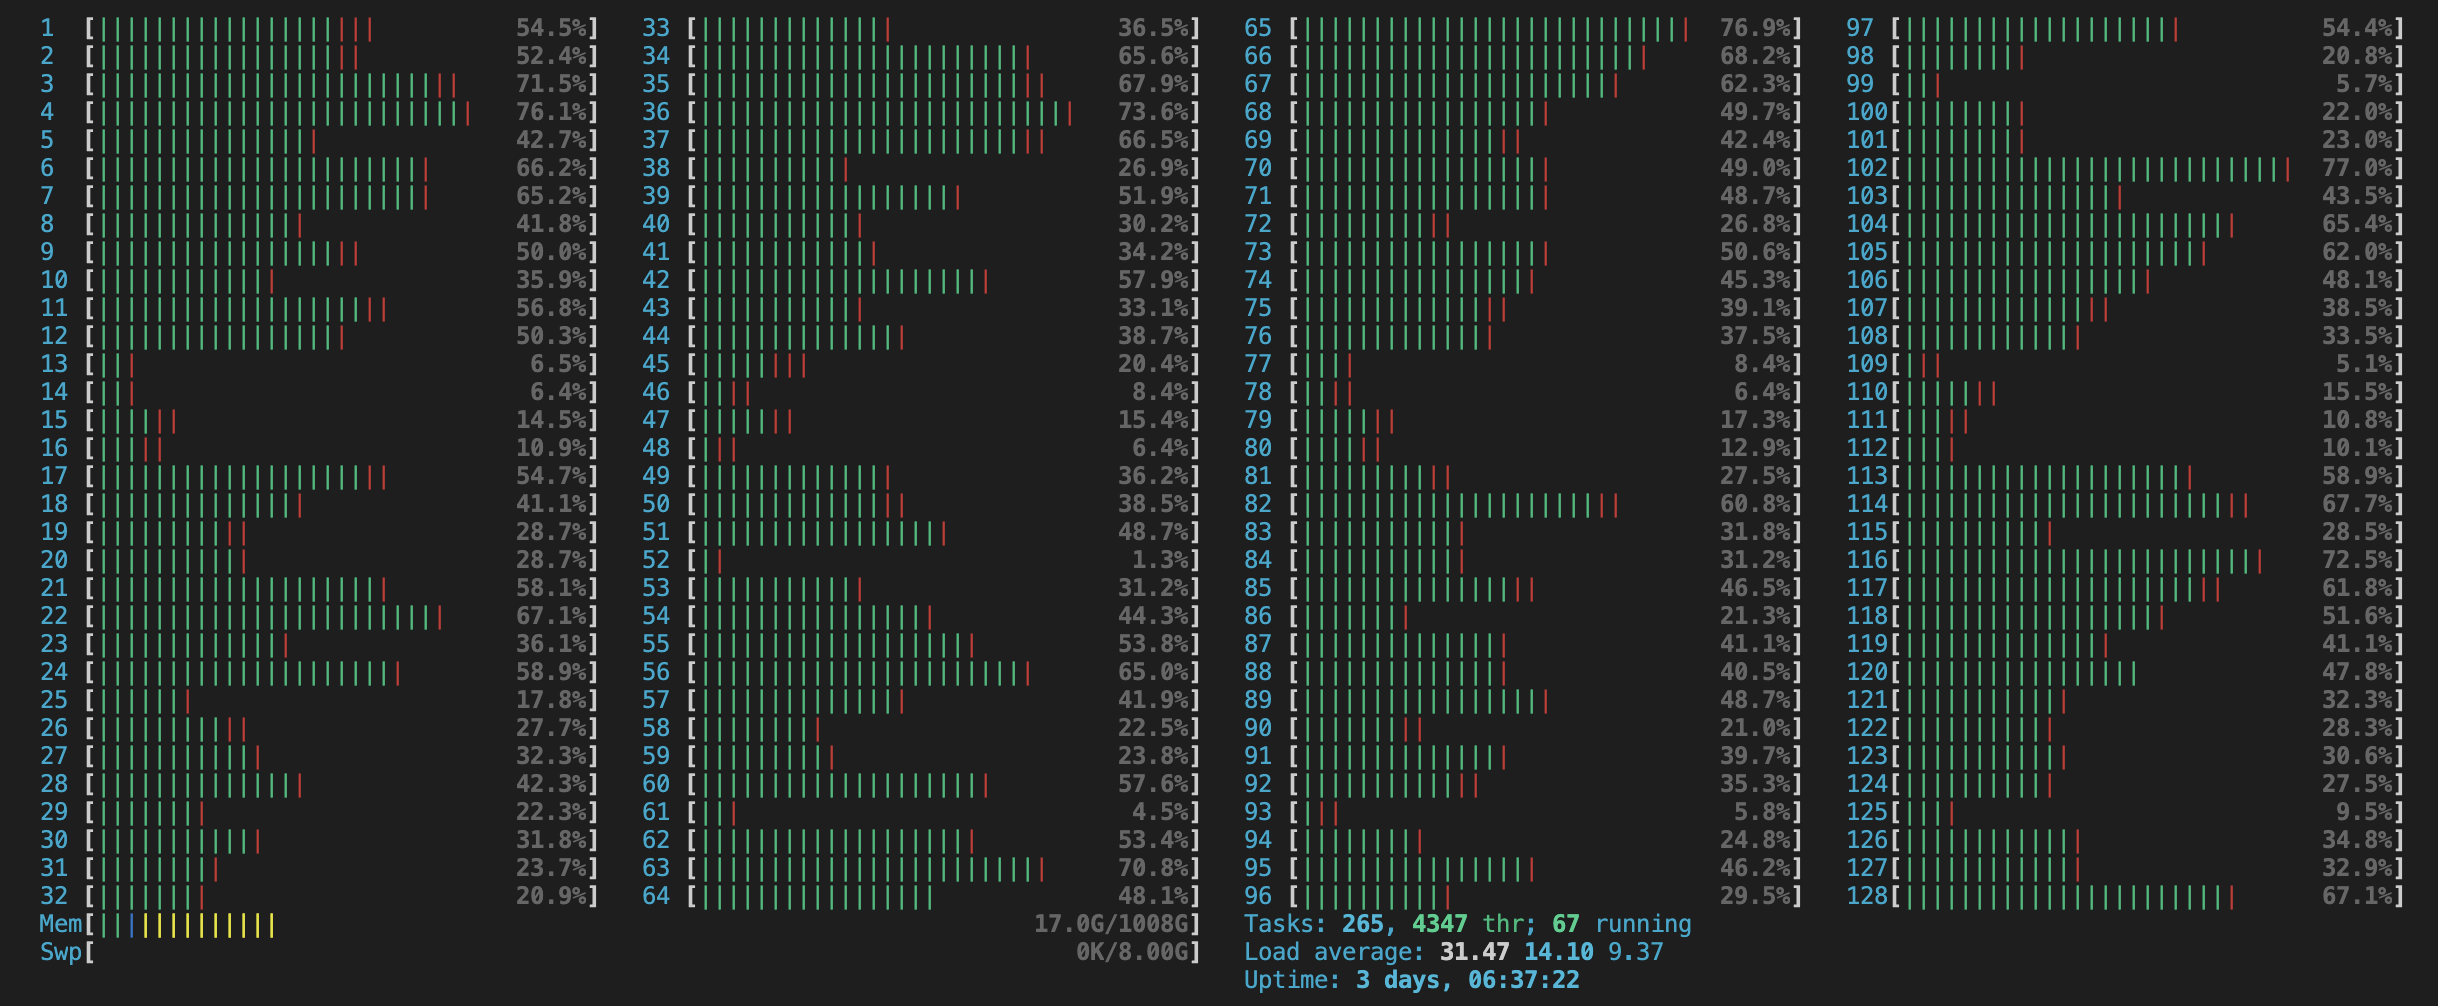
The same can be seen on htop charts.
Those are not charts of a healthy person program.
Our threads are only half-busy.
The list of available hardware events, retrieved via perfmon2, was over 2'000 lines.
Deeper introspection seemed a bit too troublesome.
Especially as AMD has far less documentation than Intel.
Maybe another time.
Impact on Industry
We presume that GPU cores are hard to organize, which is true. But so is squeezing 100% performance from CPUs. We got to 60% of CPU ⇔ RAM memory bandwidth with all the tuning and tweaking. While even the shortest and simplest GPU solutions got to 79% of GPU ⇔ VRAM bandwidth. The best GPU solution reached 94% of theoretical throughput! More visually:
| Attempt | Bandwidth | Max Bandwidth | Saturation | Time to Code |
|---|---|---|---|---|
| Parallel STL | 87 GB/s | 204 GB/s | 42.6% | 1m |
| Best CPU run | 122 GB/s | 204 GB/s | 59.8% | 60m |
| Thrust | 743 GB/s | 936 GB/s | 79.4% | 1m |
| Custom CUDA | 817 GB/s | 936 GB/s | 87.3% | 30m |
| CUB | 879 GB/s | 936 GB/s | 93.9% | 5m |
The “Time to Code” part is highly subjective and is a personal approximation. Still, our best CPU solution is not just slower than GPU code, but also much further from it’s theoretical limit. Counter-intuitive, right?
Everyone knows the PCI Gen4 bandwidth. Everyone knows that rare linear complexity operations aren’t worth transferring to GPUs. But this article isn’t about that.
Moreover, GPU code is becoming composable, just like the CPU code. You don’t even need a custom kernel-fusing compiler, like XLA or TVM. Old school expression templates are more than enough. Thrust gives you enough “fancy” iterators for most cases, and you can easily add your own. The higher the composability, the reasons to port even linear complexity code.
It’s not the first time GPU code ends up being more accessible than the CPU version. Last year I was trying to surpass cuBLAS and oneMKL in GEMM. By now, you might guess how that story developed, but I will leave it for another time.